


There has been a lot of talk recently about those nice baked goods we love to eat, and tennis players love to dish out (and avoid receiving): bagels. That got me thinking … how do the Big Four of the ATP compare against each other in terms of dishing out 6-0 sets to the opposition, specifically, how do they compare at Grand Slam events? And what do we see when we look at the WTA? My wife and I did some scavenging around on the ATP and WTA sites (the same task took us about four times longer on the WTA site, but that’s a rant for another day) and we found some interesting things. Let’s start!
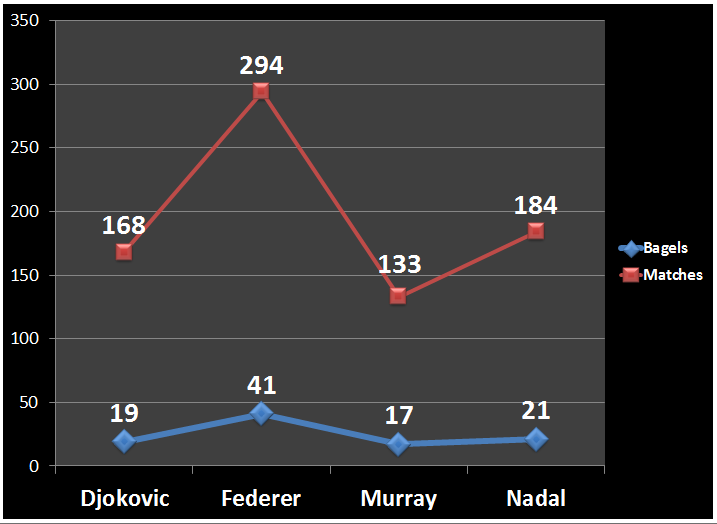
ATP Big Four: Number of Grand Slam Matches Played, and Number of Bagels Dished
Thoughts:
– This graph could also be titled: “One tends to forget Roger Federer is over five years older than the next oldest member of the Big Four”. You really see that age gap show up in the total number of Grand Slam matches played.
– There’s a smaller gap in Slam matches played between Djokovic and Nadal (16 matches), who are a year apart in age, than between Djokovic and Murray, who are a week apart in age (35 matches).
WTA Top Four: Number of Grand Slam Matches Played, and Number of Bagels Dished

Thoughts:
– Serena Williams has played 34 fewer Grand Slam matches than Roger Federer, yet they’re the same age. However, Serena has only two fewer Grand Slam titles.
– In unsurprising fashion, Radwanska sneaks in 16 bagels, even though last year was the first time that she made it past the quarterfinals at a Slam. Sneaky, sneaky Ninja.
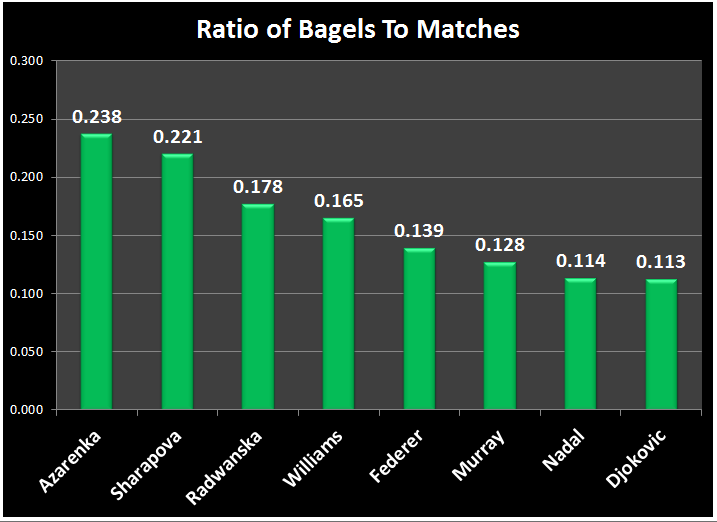
Ratio of Bagels to Matches
Now, in order to make some quick comparisons, I divided the number of bagels dished out by the number of matches played by all eight players. This measure is a very crude one, as I don’t account for sets (there’s no easy way to pull out the number of total sets played at the Slams that I could find), but I do think it can help us better visualize how the players compare to one another.
Thoughts:
– It’s not surprising that all four women lead the way. After all, there are fewer women out there with big serves, and even fewer with good second serves. Hence, more breaks of serve.
– What is slightly surprising is to see Azarenka in the lead. I say “slightly” because even though Serena and Sharapova are very good returners, they tend to be more aggressive second serve returners, while Azarenka is slightly less aggressive, but more consistent. In ATP terms, Serena and Sharapova share Agassi’s return philosophy (go for straight-up winners) while Azarenka shares Djokovic’s idea of getting a deep, relatively safe return straight back at the feet of the server.
– There’s a difference of 0.073 between the female with the highest ratio (Azarenka) and the one with the lowest (Serena), while there’s only a difference of 0.026 between the male with the highest ratio (Federer) and the one with the lowest (Djokovic). I find that fascinating.
– It’s interesting to see Murray sitting ahead of Nadal and Djokovic, since unlike those two, he hasn’t enjoyed a period of dominance over the tour. The kind of period that would result in a higher ratio of baked goods per Grand Slam match.
*****
What do you think? Do these numbers tell you something? My brain is still recovering from the Wozniacki-Lisicki match from earlier today, so I’m sure I’ve missed something. Do leave all your thoughts in the comments section below!

I’d bet anything that if you take Djokovic’s ratio pre-2011 separately from 2011-2012, those would be 2 quite different numbers.
I completely agree, Anna. After all, over 15% of Djokovic’s Slam bagels have come against the reliable Paolo Lorenzi just last year!
What’s funny is that my wife mentioned more or less the same thought, and the first thought that came to mind was the Lorenzi matches. I just checked and 11 of 19 bagels dished by Djokovic at Grand Slams have come within the past two years. 57%!
Well, in regards to the ATP, there was an easier way to do this than to go on the ATP’s website.
I went to tennisabstract.com, searched the players’ matches in grand-slams, and did Ctrl+f 6-0 (I also did “reverse loss record”, so I wouldn’t count the times the player was bageled) and saw the number of how many search results were found.
I also did this for breadsticks (6-1) and found some interesting results-
Federer- 75.
http://www.tennisabstract.com/cgi-bin/player.cgi?p=RogerFederer&f=ACareerqqC0v1
Djokovic- 69.
http://www.tennisabstract.com/cgi-bin/player.cgi?p=NovakDjokovic&f=ACareerqqC0v1
Nadal- 58.
http://www.tennisabstract.com/cgi-bin/player.cgi?p=RafaelNadal&f=ACareerqqC0v1
Murray- 45.
http://www.tennisabstract.com/cgi-bin/player.cgi?p=AndyMurray&f=ACareerqqC0v1
So in terms of the ratio of breadsticks to matches, Djokovic (0.41) comes 1st, followed by Murray (0.338), Nadal (0.315), and Federer (0.255).
I always thought that Federer chooses to conserve his energy more than the other 3, and really likes to play a very relaxed set, get the one break and go on to win it. Its strange that he is first in bagels. And because of that statistic, it is quite strange that he is last in breadsticks.
We actually followed a very similar procedure at the ATP’s site — since they let you look at all Grand Slam matches at once, it was pretty quick to pull out the bagel sets on the men’s side using ctl+f. The WTA, however, won’t let you look at all Grand Slams at once so we had to individually go through each Slam for the women.
Forgot to mention that I found the breadsticks information really interesting. 🙂 And, you’re right, it’s kind of funny that Fed and Nole swap first and last position, respectively, when you go from bagels to breadsticks. I also find it interesting that there’s a wider gap between the men when you look at breadsticks, as opposed to bagels.
tennisabstract (dot) com. Type in the player’s name. Click ‘career’ under ‘time span’, click ‘grand slam’ under ‘level’ and then add up the 3/5, 4/5, and 5/5 setters under ‘sets’ and then count the number of bagels to get your answer. Unfortunately, they only have men.
OK, I did that. Federer has played 967 sets, Nadal 595, Djokovic 553, Murray 448.
The Ratio of Bagels to Sets:
1- Federer- 0.0424.
2- Murray- 0.0379.
3- Nadal- 0.0353
4- Djokovic- 0.0343.
The Ratio of Breadsticks to Sets:
1- Djokvoic- 0.1248
2- Murray- 0.1004.
3- Nadal- 0.0975.
4- Federer- 0.0775.
Andrew, you are just awesome. Thank you so much for all of this!
Much like Djokovic’s bi-modal bagel conversion rate pre-post 2011, it would be interesting to compare Federer’s rate between 2004-2007 and 2008-2012. Federer still has an excellent hold game, but in my mind, his return game has steadily eroded over the last 3-4 years.